Feeds:
Posts
Comments

Archive for May, 2010

The latest NZ political poll is a One News-Colmar Brunton poll that was published on Sunday, May 30. The poll shows a drop in support for National of 5%, and no change in support for Labour (33%) relative to the previous Colmar Brunton poll published in late April.

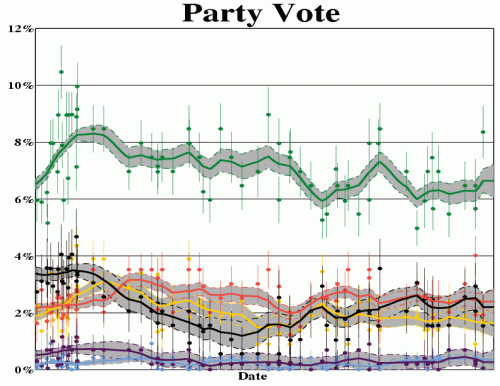
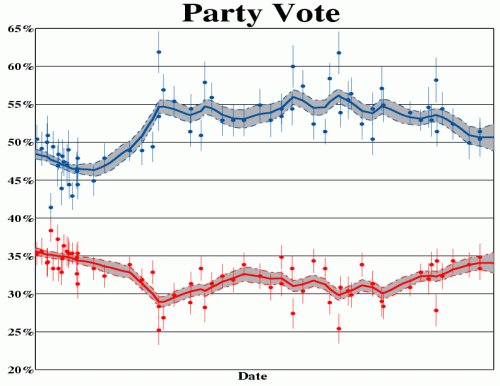
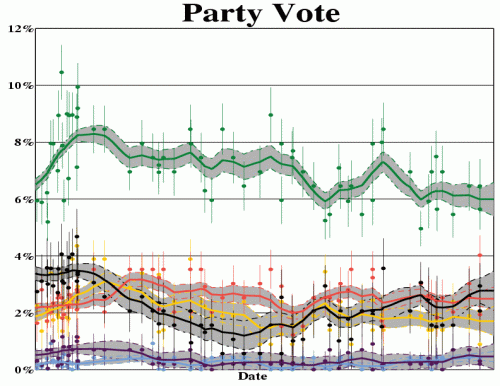
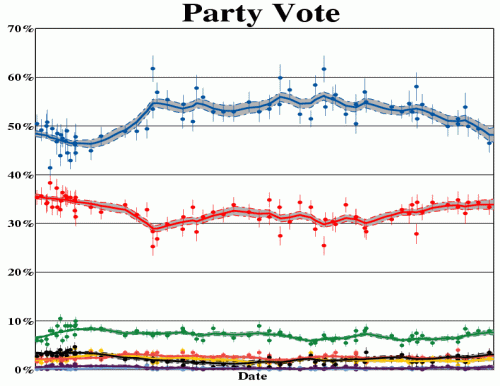
As usual, the two graphs below summarise the polling averages for the party vote after the new poll. The horizontal axes represent the date, starting 60 days before the 2008 NZ General Election, and finishing on the present day. The solid lines with grey error bands show the moving averages of the party vote for each party, and circles show individual polls with the vertical lines representing the total errors.
Party vote support for the eight major and minor NZ political parties

Party vote support for the eight major and minor NZ political parties as determined by moving averages of political polls. Colours correspond to National (blue), Labour (red), Green Party (green), New Zealand First (black), Maori Party (pink), ACT (yellow), United Future (purple), and Progressive (light blue) respectively.
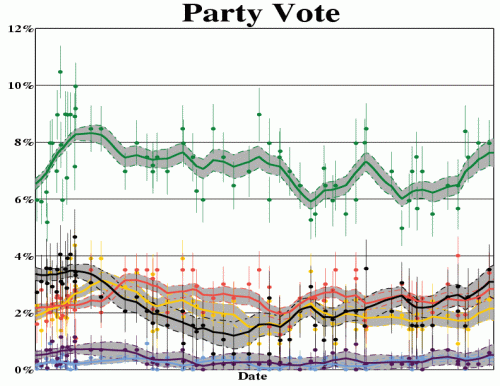
Party vote support for the six minor NZ political parties

Party vote support for the six minor NZ political parties as determined by moving averages of political polls. Colours correspond to Green Party (green), New Zealand First (black), Maori Party (pink), ACT (yellow), United Future (purple), and Progressive (light blue) respectively.

The latest scenario analysis graph is also shown below:
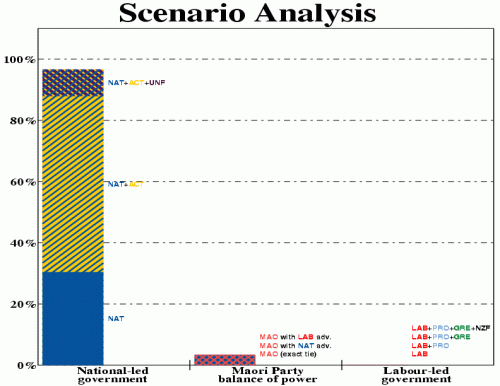
Scenario analysis for 31st May 2010

Scenario analysis for 31st May 2010. The bar graph shows the probabilities for different possible outcomes for a NZ General Election if held on that date. The National Party are estimated to have a roughly 31% probability of winning an outright majority of the seats in Parliament.

The National Party are predicted to have a roughly 31% probability of winning an outright majority, with a roughly 58% probability that a National/ACT coalition would have a majority between them. There is an estimated total of roughly 97% probability of a National-led government, with a roughly 3% probability that the Maori Party will hold the balance of power if an election were held on May 31st (although in these cases the center-right parties would most likely hold more seats between them than the centre-left parties).

As always, please check the Graphs page for further simulation results.
Read Full Post »

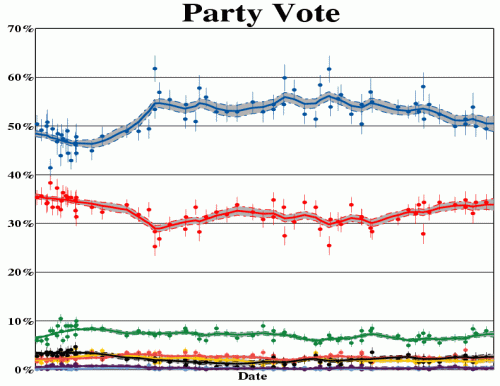
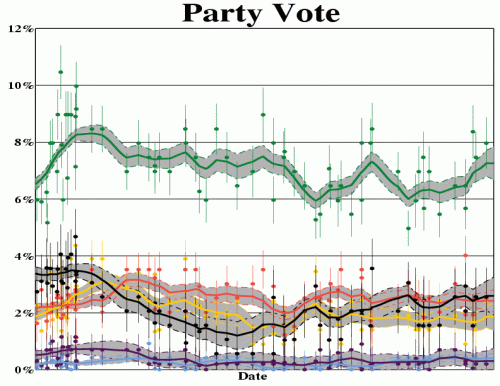
The latest NZ political poll was released by Roy Morgan Research on Wednesday, May 19. For unknown reasons the poll comes just one week after the release of the previous poll, although the new poll was conducted over the usual fortnightly polling period, so it seems that the cause was most likely just the late release of the previous poll. The poll shows a continuation of the gradual decline in support for the National Party that has been visible since about late November 2009. In fact the last four Roy Morgan polls all have National on less than 50% support, a barrier they have not broken since February 2009. The major beneficiary of the decline in support for National seems to be the Green Party, who have made a statistically significant improvement in the Kiwi Poll Guy polling averages from just over 6% four months ago to over 7% in the most-recent averages.

As usual, the two graphs below summarise the polling averages for the party vote after the new poll. The horizontal axes represent the date, starting 60 days before the 2008 NZ General Election, and finishing on the present day. The solid lines with grey error bands show the moving averages of the party vote for each party, and circles show individual polls with the vertical lines representing the total errors.

Party vote support for the eight major and minor NZ political parties

Party vote support for the eight major and minor NZ political parties as determined by moving averages of political polls. Colours correspond to National (blue), Labour (red), Green Party (green), New Zealand First (black), Maori Party (pink), ACT (yellow), United Future (purple), and Progressive (light blue) respectively.

Party vote support for the six minor NZ political parties

Party vote support for the six minor NZ political parties as determined by moving averages of political polls. Colours correspond to Green Party (green), New Zealand First (black), Maori Party (pink), ACT (yellow), United Future (purple), and Progressive (light blue) respectively.

As always, please check the Graphs page for further simulation results.
Read Full Post »

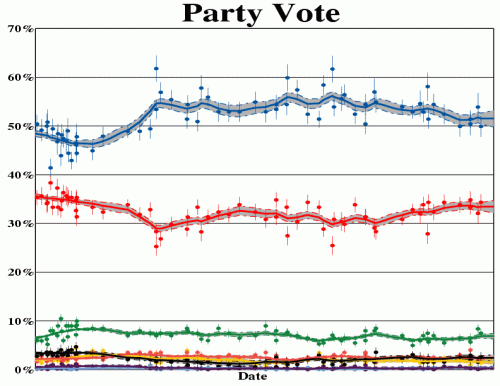
The latest NZ political poll was released by Roy Morgan Research on Tuesday, May 11. The poll does not show any significant changes for any of the major or minor NZ political parties relative to the previous Roy Morgan poll.

As usual, the two graphs below summarise the polling averages for the party vote after the new poll. The horizontal axes represent the date, starting 60 days before the 2008 NZ General Election, and finishing on the present day. The solid lines with grey error bands show the moving averages of the party vote for each party, and circles show individual polls with the vertical lines representing the total errors.

Party vote support for the eight major and minor NZ political parties

Party vote support for the eight major and minor NZ political parties as determined by moving averages of political polls. Colours correspond to National (blue), Labour (red), Green Party (green), New Zealand First (black), Maori Party (pink), ACT (yellow), United Future (purple), and Progressive (light blue) respectively.

Party vote support for the six minor NZ political parties

Party vote support for the six minor NZ political parties as determined by moving averages of political polls. Colours correspond to Green Party (green), New Zealand First (black), Maori Party (pink), ACT (yellow), United Future (purple), and Progressive (light blue) respectively.

As always, please check the Graphs page for further simulation results.
Read Full Post »

Trying to get home from Japan and somehow ended up Kota Kinabalu International Airport. Nice surprise. I definitely picked the wrong day to travel though, as I’m missing out on the UK election results. Various sites such as Electoral Calculus and FiveThirtyEight have been trying to use a variety of techniques to predict the result of the UK Election, with fairly poor agreement. It will be interesting to see who’s predictions are closest to the final result, and why, because I may end up using some of the better methodology to tweak the calculations I use to predict the electorate seats hear at Kiwi Poll Guy.

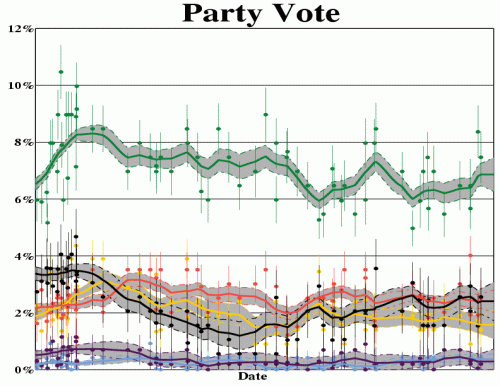
Anyway, back to business. I stumbled upon a new poll on Wikipedia that I missed when it was originally released. The TV3-TNS poll was released on Sunday, April 25. It seems that TV3 has returned to using TNS as their pollsters after spending the year or so since the last election with Reid Research. Very interesting decision if it isn’t a one-off change. The TV3-TNS poll was one of the most accurate polls in the lead-up to the 2008 General Election, whereas the TV3-Reid Research poll has tended to over estimate support for National at the expense of Labour for most of the last year. In fact a couple of their polls had National polling at over 60% during the past year, which was definitely a bit iffy given that the polling averages never had National over 57%. I’ll have to have a further look into this problem in the near future.

As usual, the two graphs below summarise the polling averages for the party vote after the new poll. The horizontal axes represent the date, starting 60 days before the 2008 NZ General Election, and finishing on the present day. The solid lines with grey error bands show the moving averages of the party vote for each party, and circles show individual polls with the vertical lines representing the total errors.

Party vote support for the eight major and minor NZ political parties

Party vote support for the eight major and minor NZ political parties as determined by moving averages of political polls. Colours correspond to National (blue), Labour (red), Green Party (green), New Zealand First (black), Maori Party (pink), ACT (yellow), United Future (purple), and Progressive (light blue) respectively.

Party vote support for the six minor NZ political parties

Party vote support for the six minor NZ political parties as determined by moving averages of political polls. Colours correspond to Green Party (green), New Zealand First (black), Maori Party (pink), ACT (yellow), United Future (purple), and Progressive (light blue) respectively.

As always, please check the Graphs page for further simulation results.
Read Full Post »

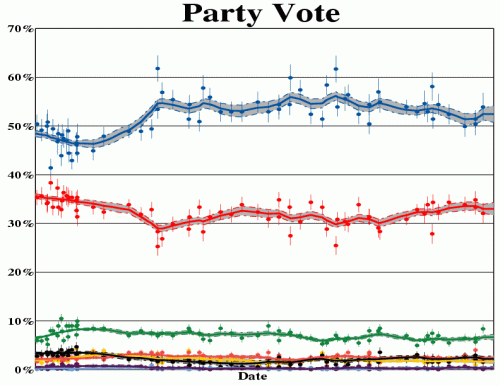
The latest NZ political poll was released by Roy Morgan Research on Tuesday, April 27. The poll does not show any significant changes for any of the major or minor NZ political parties relative to the previous Roy Morgan poll.

As usual, the two graphs below summarise the polling averages for the party vote after the new poll. The horizontal axes represent the date, starting 60 days before the 2008 NZ General Election, and finishing on the present day. The solid lines with grey error bands show the moving averages of the party vote for each party, and circles show individual polls with the vertical lines representing the total errors.

Party vote support for the eight major and minor NZ political parties

Party vote support for the eight major and minor NZ political parties as determined by moving averages of political polls. Colours correspond to National (blue), Labour (red), Green Party (green), New Zealand First (black), Maori Party (pink), ACT (yellow), United Future (purple), and Progressive (light blue) respectively.

Party vote support for the six minor NZ political parties

Party vote support for the six minor NZ political parties as determined by moving averages of political polls. Colours correspond to Green Party (green), New Zealand First (black), Maori Party (pink), ACT (yellow), United Future (purple), and Progressive (light blue) respectively.

As always, please check the Graphs page for further simulation results.
Read Full Post »